
产品详情
文献和实验
相关推荐
库存 :大量
供应商 :德国耐尼恩
现货状态 :有货
保修期 :一年
规格 :Patchliner
Patchliner - 兼顾科研与药物研发
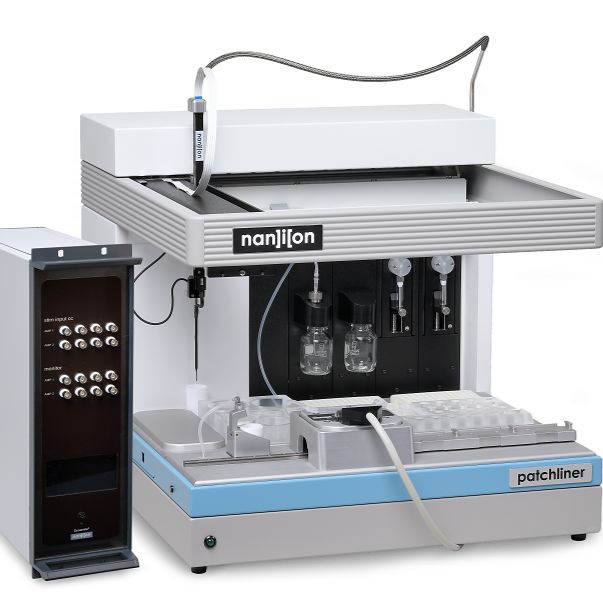
Patchliner是一个全自动膜片钳系统,可以同时记录4个或8个细胞。HEKA EPC10放大器,对移液器速度的完全控制,能够实时更改协议,灵活的温度控制插件和动态夹具使该仪器成为市场上最通用的APC系统。自2006年推出以来,Patchliner已经得到了学术界、工业界和cro的广泛认可。硬件:
- 可对细胞外液与内液进行灌流
- 可无限次数给药(由于持续对废液移除)
- 温度控制 (见Applications)
- 可制冷的细胞池
- 支持电压钳 & 电流钳记录 + 动态钳制技术
- 有4通道与8通道两个配置可供选择
- 有自产的单孔 & 多孔芯片
- 串联电阻Rseries补偿
应用:
- 电压与配体门控离子通道
- 温度激活通道
- 在生理温度下记录
- 全细胞l & 穿孔膜片钳
- 细胞系、原代细胞与干细胞
- 为CiPA而验证的系统
- 极少的细胞消耗
- 易用 & 定制的分析工具
Patchliner是多功能而坚固的,非常适合离子通道生物物理学和作用机制的基础研究,复杂的分析,如热激活,一直到常规分析,如hERG或其他心脏离子通道的安全筛查,符合CiPA倡议。
Patchliner是一种中等吞吐量的自动膜片钳系统,有4或8通道版本。实验协议使用PatchControlHT软件编程,该软件控制Tecan机器人进行溶液、细胞和化合物的添加,并控制PatchMaster软件进行数据采集。Patchliner的耗材NPC-16芯片可以装载在芯片车上,仪器可以在无人看管的情况下运行48次录音。
Patchliner作为一个完整的系统提供,包括Tecan移液机器人,HEKA EPC10放大器,NPC-16芯片,试剂启动器套件和所有必需的软件。附加的温度控制,冷却CellHotel和动态钳(Dynamite8)也可扩展实验的可能性。
我们的电生理学家和工程师团队致力于持续的内部分析开发,软件和硬件的进步,确保快速和定制化的解决方案,满足您的分析需求。
Patchliner
Patchliner平台是一个完整的自动化膜片钳系统,可以同时记录4个或8个细胞。该系统包含1或2个HEKA EPC10 Quadro放大器,用于数据采集和分析的软件,NPC-16芯片和一个试剂启动器套件,以确保您从第一天开始就得到结果。
Patchliner Temperature Control
Patchliner的温度控制插件可用于加热Patchliner的测量头,芯片车和移液管。每个组件的温度可以单独设置,以确保电池的最佳温度。理想的记录在生理温度和瞬态温度跳跃,以激活热激活离子通道。
Patchliner CoolingPlate
该Patchliner冷却板是一个附加的Patchliner冷却电池和解决方案。这提高了溶液的稳定性和细胞的活力,从而增加了密封阻力和整个细胞的稳定性,甚至在收获数小时后。CellHotel加上8个Eppendorf管可以同时冷却。
Patchliner Dynamite8
Dynamite8是Patchliner的全自动动态夹具附件。IK1模拟和密封补偿分别为每个细胞计算,同时多达8个细胞,从而获得更稳定的负静息膜电位,以及从人诱导多能干细胞来源的心肌细胞(hiPSC-CMs)中记录的APs的稳定性和形状。Dynamite8是唯一完全集成到自动化膜片钳仪器的自动化动态夹具系统。
Patchliner Safety Edition
Patchliner安全版完全配备了所有更新的CiPA推荐的电压协议和标准操作规程,以及温度控制,冷却板和Dynamite8附加组件。Patchliner包含在一个特别设计的外壳中,以确保安全的环境,安装和培训的重点是安全的药理学实验。
PatchControlHT software
Patchliner的软件包括用于控制机器人动作和实验工作流程的PatchControlHT和用于电生理数据采集的PatchMaster。PatchControlHT是一个图形用户界面,通过使用预先编程的模块或根据特定的用户需求设置定制的协议,可以直接轻松地编程协议。PatchControlHT可以完全自动化地运行,从开始到结束控制实验,但也可以动态地进行更改,这对于分析开发和学术研究来说是一个特别有用的功能。由于其固有的逻辑编程能力,实验冗余被减少到最小,从而最大限度地提高数据吞吐量。此外,PatchControlHT兼容各种文档和数据库格式,使化合物加载和数据分析在筛选大量化合物时更快、更容易。

使用Nanion的Data Analysis Package,一个高效方便的数据分析工具,可以很容易地对数据进行分析。只需几次鼠标点击,就可以加载、显示、分析和合并原始数据,将工作减少到最低限度。自动计算并显示电流-电压关系图和浓度响应曲线。每口井的Vhalf值和IC50或EC50值都显示出来,并计算出所有活性井的平均值。显示原始的电流轨迹和时间轨迹,便于判断每口记录井的数据质量。可以很容易地从数据集中排除单个细胞,并重新计算平均浓度反应曲线和IC50或EC50值。多个芯片和多个天的数据可以合并,并可以分析累积添加或单点添加方案。
NPC-16 chip

NPC-16芯片是Nanion Technologies为Patchliner开发的专利创新产品。它在Nanion总部内部生产和质量保证,并从慕尼黑运送到我们的国际客户。不同类型的NPC-16芯片可供选择,应根据细胞大小和应用。
Available chip types
"NPC-16, 1x, medium resistance": One hole/well, 1.8 - 3 MOhm (Order # 071102)
"NPC-16, 4x, medium resistance": Four holes/well, ~1 MOhm (Order # 071401)
"NPC-16, 1x, low resistance": One hole/well, 1.5 - 2 MOhm (Order # 071103)
"NPC-16, 1x, high resistance": One hole/well, 3 - 5 MOhm (Order # 071101)
"NPC-16, 1x, ultra-high resistance": One hole/well, 5 -8 MOhm (Order # 071104)
Other resistances available upon request!
Patchliner 数据与应用
Acetylcholine Receptor Alpha 3 Beta 4 - Concentration Response Curve to Nicotine

Shown are the a raw current responses of a HEK293 cell expressing AChR (α3β4) to increasing concentrations of nicotine. Solutions were stacked (layered) in the pipette to achieve brief exposure times.
Acetylcholine Receptor Alpha 7 - Activation and Dose Response Curve

Cells were kindly supplied by Galantos Pharma GmbH.
Complete nicotine dose response curves were obtained by applying increasing concentrations of nicotine to a HEK293 cell expressing human nicotinic α7 acetyl choline receptors. The stacked application protocol was used.
Acetylcholine Receptor Alpha 7 - Enhancement by NS1738

Cells were kindly supplied by Galantos Pharma GmbH.
Concentration response curve for NS1738 co-applied with 300 μM ACh revealed an EC50 = 2.6 ± 1.1 μM (n = 4). This is in excellent agreement with the literature (Timmermann et al, 2007, JPET 323: 294–307).
Acetylcholine Receptor Alpha 7 - Enhancement of cabamoylcholine and epidatidine responses by PNU120596

Cells were kindly supplied by Galantos Pharma GmbH.
Representative current records of carbamoylcholine- and epibatidine-induced nAChR activation in the absence and presence of PNU-120596. Horizontal bars indicate exposure time (233 ms) of compound(s) to the cell. Data from Scheffel et al, 2018.
Acetylcholine Receptor Alpha 7 - Enhancement of nicotine and acetylcholine responses by PNU120596

Cells were kindly supplied by Galantos Pharma GmbH.
Representative current records of hα7-nAChR responses induced by nicotine and acetylcholine (ACh) (50, 100, 500 μM) in the absence (top) and presence of PNU-120596 (5, 10, 50 μM) (bottom). Horizontal bars indicate exposure time (233 ms) of compound(s). Data from Scheffel et al, 2018.
Acetylcholine Receptor Alpha 7 - Stable nicotine responses

Cells were kindly supplied by Galantos Pharma GmbH.
Stable whole-cell current amplitudes were obtained by repeated 100 mM nicotine stimulation of HEK293 cells expressing human nACha7 receptors. The stacked application protocol was used.
AMPA Receptor (GluA2) - Fast Activation

Cells were kindly provided by University of Sussex.
Shown is concentration dependent activation of GluA2 receptors (known as AMPA receptors) by 10 μM, 30 μM, 100 μM, 300 µM and 1 mM Na-Glutamate from a GluA2 expressing HEK293 cell. The rising phase is enlarged in the right graph.
AMPA Receptor (GluA2) - Inhibition by CNQX
 Patchliner data and applications:
Cells were kindly provided by SB Drug Discovery.
The AMPA receptor (GluA2) was blocked by CNQX on the Patchliner. CNQX was pre-incubated and then co-applied with glutamate. CNQX blocked the GluA2-mediated response in a concentration dependent manner and the potency was dependent on glutamate concentration (left). Exemplar GluA2-mediated responses are shown on the right activated by 100 µM glutamate and inhibited by increasing concentrations of CNQX.
Astrocytes - Analysing Potassium Currents

Data are taken from Milligan C.J. et al., Nature Protocols, 2009, 4(2), 244-255
Left: Comparison of K+ current voltage relationships for rat astrocytes on the Patchliner (closed circles, n = 19) and on a conventional setup (open squares, n = 10). Currents were measured as a response to a voltage step protocol.
Right: Normalized K+ current amplitudes in rat astrocytes. Internal solution was changed to the same solution (K+, open circles, n = 7) or to one where Cs+ was substitued for K+ (Cs+,closed circles, n = 7). Currents were measured as responses to voltage steps from −100 mV to +40 mV.
Astrocytes - Internal Perfusion

Data courtesy of C. Peers, University of Leeds, Leeds, UK.
Whole cell currents from rat cortical astrocytes (primary culture) were evoked by 500 ms long depolarizing voltage steps (-100 mV to +40 mV). Currents were blocked by administration of internal Cs+, and recovered when switching back to Cs+-free internal solution. Averaged data are presented as mean ± S.E.M. (n=35). For more information, see Nature 254, 4 (2), 2009.
Cardiac Action Potentials - Automated recordings from iCells

The stem cell-derived cardiomyocytes (iCell) were kindly supplied by Cellular Dynamics.
In this example both Na+ and Ca2+ mediate the action potential. When nifedipine is applied in the current clamp mode, the action potential is shortened significantly due to block of the calcium channels.
Cardiac Action Potentials - From SC-Derived Cardiomyocytes

Cells were kindly provided by Ncardia.
Action potentials recorded from stem-cell derived cardiomyocyetes (Cor.At® cardiomyocytes). Action potentials are triggered by small current pulses. Effects of quinidine and lidocaine on the action potentials are shown.
Cardiac Ion Channels - Pharmacology of Sodium Channels

Cells (Cor.AT) were kindly provided by Axiogenesis.
The pharmacology of dibucaine was investigated by the application of 0.3, 1, 3, 10 μM in the presence of 10 μM nifedipine (L-type Ca2+-current blocker). Two control additions of nifedipine (10 μM) were made before the addition of increasing concentrations of dibucaine. The IC50 value was determined as 355 ± 40 nM (n=3), which is in accordance with the literature.
Cardiac Ion Channels - Pharmacology of Vandetanib

Cells were kindly provided by Charles River and Cellular Dynamics.
The image on the left hand side displays the results of the blocking effect of Vandetanib on hERG, NaV1.5, CaV1.2 and KV4.3. The compound induced arrhythmia when iPSC-CM were exposed to a minimum concentration of 1 µM. Arrhytmic events were both detected in field potential recordings as well as in the impedance based contractility.
Cardiac Ion Channels - Recordings from SC-Derived Cardiomyocytes

Cells were kindly provided by Ncardia.
The left picture shows a typical action potential from Cor.At® cardiomyocytes. Whole cell currents recorded in the voltage clamp mode reveal cardiomyocyte-typical ion channels (right). The traces represent mERG-, L-type Ca2+- (blue, block by 50 μM nifedipine), Na+- and K+-currents (from top left to bottom right).
CaV2.2 - Cadmium Block

Cells were kindly provided by Millipore.
The image shows current response of an individual cell in the presence of increasing cadmium concentrations. The IC50 was calculated from the Hill fit to be 3.6 ± 0.4 μM (n = 5).
CaV2.2 - Current Voltage Relationship

Cells were kindly provided by Millipore
Representative current responses of an individual cell expressing CaV2.2 to a I/V voltage protocol. The average peak current at 30 mV of all recorded cells was -698 ± 115 pA (n = 6).
CaV3.2 - Current-to-Voltage Relationship

Cells were kindly provided by Millipore
Representative current responses of an individual cell expressing Ca 2.2 to a standard voltage protocol. The average mean current at -20 mV of all recorded cells was -785 ± 110 pA (n = 12).
CaV3.2 - Inactivation

Cells were kindly provided by Millipore.
Current responses of a double pulse protocol with varying test potentials between the pulses (5 s) was used to determine the half inactivating potential. Peak current responses to the second pulse are expressed relative to the response to the first pulse. Both curves in Figure 5 were fitted to the Boltzmann equation and revealed a half-inactivating potential of -65 mV and a half-activating potential of -33 mV.
CaV3.2 - Mibefradil Antagonism

Cells were kindly provided by Millipore.
Dose dependent block by Mibefradil on current traces from an individual cell expressing CaV3.2. Data was averaged and fitted to the Hill equation
CFTR - Regulation

The Cystic Fibrosis Transmembrane Conductance Regulator (CFTR) is activated by forskolin. The upper graph shows the timecourse of currents recorded at +95 mV. The bar above the data indicates the time of compound application. Arrows indicate data from which time points were averaged in the lower figure (n = 3).
You can download the full report here.
Erythrocytes - Single Channel Recordings

The membrane of erythrocytes contains different ion channels like Ca2+-activated K+ channels, or the volume-sensitive Na+/K+ pump. Studies also revealed the participation of a Ca2+-permeable non-selective cation channel in the regulation of erythrocyte 'apoptosis'. Shown are single channel fluctuations as recorded from an erythrocyte in the cell attached configuration on the Patchliner.
Erythrocytes - Whole Cell Recordings

Cells were kindly donated by Dr. Andrea Brüggemann.
Whole cell current recordings from erythrocytes recorded on an eight-channel Patchliner.
GABAA Receptor - Currents in iCell Neurons

Cells were kindly provided by Cellular Dynamics.
Activation of GABAA receptor currents by 30 μM GABA and partial block of the current response by 1 μM bicuculline. Bicuculline was pre-applied for at least 30 s before co-application with GABA (30 μM). Approximately 50% of the current was blocked by 1 μM bicuculline.
GABAA Receptor - Stacked Application Technology

Ligand gated ion channels often display receptor desensitization. A method was developed to minimize ligand exposure times and intervals between ligand exposures. The pipette first aspirates buffer, then compound. When expelling this stack, the cell is first exposed to ligand and then buffer. Exposure times as low as 400 ms are possible with this method. A GABA dose response curve, aquired in this manner, is shown on the left.
GABAA Receptor (a1b2g2) - Activation

Shown is concentration dependent activation of GABAA (α1β2γ2) receptors. Shown is the average concentration response curve for an average of 7 cells and the example traces from one cell.
GABAA receptors - Investigation of Modulators

Cells were kindly provided by AstraZeneca.
The top images show dose dependent block of GABAA currents by bicuculline. The IC50 was determined as 1.2 ± 0.2 μM (n=11). The lower graph shows the positive modulation of glycine activation of hGlyRα1. Here, six co-applications of 20 μM glycine and increasing concentrations of a positive modulator are shown.
Glycine Receptor - Potentiation

Cells and the positive modulator were kindly provided by Astrazeneca, Södertälje, Sweden.
Original traces of one application of 20 μM glycine followed by 6 applications of 20 μM glycine in conjunction with increasing concentrations of a positive modulator. 1 mM glycine was used as a second positive control.
Glycine Receptor (GlyRa1 & GlyRa3) - Dose Response Analysis

(A) Effects of indicated concentrations of 3 on α1 and α3 GlyR currents activated by EC20 glycine concentrations as indicated. Unfilled bars denote glycine applications and filled bars denote compound applications. (B & C) Average dose response curves of 3 at α1 and α3 GlyRs, respectively.
Data are taken from Balansa W. et al., Bioorg Med Chem. 2010 Apr 15;18(8):2912-9.
Glycine Receptor (GlyRa1) - Accurate Pharmacology

Cells were kindly provided by AstraZeneca.
Two different application protocols were used to study the effect of exposure time on glycine receptor pharmacology for cells expressing hGlyRα1. As shown from the raw data traces and corresponding Hill plots, the highest concentration, 3 mM glycine, did not elicit the maximum peak response during long exposures (22 s), in contrast to stacked applications (1 s).
Glycine Receptor (GlyRa1) - Antagonist

Cells were kindly provided by Astrazeneca, Södertälje, Sweden.
The figure shows current responses of a hGlyRα1 expressing L-tk cell to alternating exposures to 100 μM glycine and 100 μM glycine + 1 μM strychnine.
Gramicidin - Bilayer Recordings

With suction the GUVs are attracted to the aperture. As soon as one GUV hits the glass substrate, it bursts and forms a bilayer across the aperture. Shown are single channel recordings from gramicidin which was incorprated into the bilayer after its formation. Traces were recorded in 100 mM HCl at −100 mV.
hERG - Application of "Sticky Compounds"

hERG expressing HEK293 cells were kindly provided by Cytomyx/Millipore.
Even sticky compounds pose no problem for the Patchliner. IC50 measurements of well known sticky substances were determined on the Patchliner: Terfenadine IC50 = 11.0 ± 3 nM, Flunarizine IC50 163.7 ± 19 nM and Cisapride IC50 8.9 ± 3 nM.
hERG - Block at Physiological Temperature

Cells were kindly provided by Cytomyx/Millipore, UK.
The effects of erythromycin on hERG currents were tested at different temperatures. Erythromycin has been shown to block hERG channels at physiological temperature with an IC50 of approx. 40 µM. However, at RT erythromycin is much less potent. For more details on these experiments please refer to the Application Note.
hERG - Efficient Screening

Cells were kindly provided by Cytomyx/Millipore.
The effects of six different blockers (terfenadine, cisapride, E4031, astemizole, propafenone, quinidine) on hERG currents (HEK293 cells) were investigated. Expected IC50 values for the different compounds were obtained. In two days, 119 full dose response curves were collected by a single person. Data was analyzed using Nanion’s Data Analysis Package, a very efficient and convenient data analysis tool!
hERG - Pharmacology of Bepridil, Dofetilide, Cisapride, Diltiazem (Results CiPA Phase I Study)
 Patchliner data and applications:
Cells were kindly provided by Charles River.
The effect of four compounds on hERG currents were investigated, using the CiPA voltage step protocol. Measured on the Patchliner the perforated patch methodology (Escin) and multi-hole chips (4 holes per well) were used. The IC50 value of Cisapride was determined as 112 nM, Bepridil as 178 nM, Dofetilide as 33.9 nM and Diltiazem as 14.5 µM.
hERG - Pharmacology of Cisapride, using the CiPA protocol
 Patchliner data and applications:
Cells were kindly provided by Charles River.
The effect of cisapride on hERG currents was investigated, using the CiPA voltage step protocol. Measured on the Patchliner the perforated patch methodology (Escin) and multi-hole chips (4 holes per well) were used. The IC50 value of Cisapride was determined as 112 nM.
hERG - Pharmacology of Mexiletine, Quinidine, Ondansetron, Ranolazine (Results CiPA Phase I Study)
 Patchliner data and applications:
Cells were kindly provided by Charles River.
The effect of four compounds on hERG currents were investigated, using the CiPA voltage step protocol. Measured on the Patchliner the perforated patch methodology (Escin) and multi-hole chips (4 holes per well) were used. The IC50 value of Mexiletine was determined as 77.3 µM, Quinidine as 1.04 µM, Ondansetron as 1.13 µM and Ranolazine as 11.9 µM.
hERG - Pharmacology of Sotalol, Terfenadine, Verapamil (Results CiPA Phase I Study)
 Patchliner data and applications:
Cells were kindly provided by Charles River.
The effect of four compounds on hERG currents were investigated, using the CiPA voltage step protocol. Measured on the Patchliner the perforated patch methodology (Escin) and multi-hole chips (4 holes per well) were used. The IC50 value of Sotalol was determined as 157 µM, Terfenadine as 82.8 nM and Verapamil as 485 nM.
hERG - Simple Data Analysis

With our analysis tools, especially programmed routines in Igor make dose response curves, raw data and current time courses easily accessible. Also, creating average dose response curves over multiple experiments - even conducted on different days - remains easy.
hERG - Stable Recordings

Cells were kindly provided by Cytomyx/Millipore, UK.
A series of drug concentrations can be applied to each cell. The top figures show the original traces and the corresponding average dose-response curve. Five concentrations of Quinidine (0.1, 0.3, 1, 3 and 10 μM) have been applied.
The lower figure shows the corresponding Imax (-40 mV) including a wash out step and an additional application of the blocker to demonstrate the stability of whole cell recordings.
KCa1.1 (BK) - Activation by Internal Calcium

Top: BK (KCa1.1) current voltage relationships in a single cell showing effects of changing the intracellular free Ca2+ concentration (15 nM, n = 9; 108 nM, n = 11; 316 nM, n = 11).
Bottom: Comparison of BK (KCa1.1) current voltage relationships obtained on a conventional patch clamp setup (closed circles, n = 10) and on the Patchliner (open circles, n = 11).
Data are taken from Milligan C.J. et al., Nature Protocols, 2009, 4(2), 244-255.
KCNQ1/KCNE1 - block by Chromanol 293B

Data kindly provided by ApconiX, UK
KCNQ1/KCNE1 expressed in CHO cells was activated using a 2 s voltage step to 40 mV and blocked by increasing concentrations of chromanol 293B. Shown are traces from an example cell in the absence and presence of chromanol 293B and the normalized concentration response curve for an average of 6 cells. The curve was fit with a Hill equation revealing an IC50 = 2.8 ± 0.9 μM (n = 6).
Kir channels - Rapid external solution exchange study in RBL cells

The basophilic leucaemia cells (RBL) exhibit an inwardly rectifying potassium current, Kir. Changing the external K+ concentration (here between 4.5 mM and 143 mM) leads to a change of the current amplitude of the inward current (holding: -100 mV). This gives us a convenient tool to study the speed of the external solution exchange which was determined as ~50 ms.
KV1.3 - Internal Solution Exchange during Recording

A unique feature of the Patchliner is its ability to exchange the internal solution during the recording. The figure shows recordings of KV1.3 from two Jurkat cells (simultaneoulsy recorded) in the presence of control internal solution, after the exchange of the internal solution with a Cs+ solution, and subsequent washout (left to right).
KV1.3 - Reproducible Compound Application

Application of 5 μM quinidine leads to about 50 % block of the KV1.3 currents (blue). After washout, the current is fully recovered (grey). The lower graph shows corresponding Imax (+40 mV) in the absence and presence of 5 μM quinidine, for two different cells with eight consecutive application and washout steps. The recording lasted over 40 minutes!
KV7.1 (KVLQT) - current-voltage relationship

Data kindly provided by ApconiX, UK
KCNQ1/KCNE1 expressed in CHO cells was activated using increasing voltage steps. Shown are traces from an example cell and the normalized current-voltage plot for an average of 8 cells. The IKs current mediated by KCNQ1/KCNE1 started to activate at approximately -20 mV and increased with each voltage step (increment 10 mV). The normalized IV curve was fit using a Boltzmann equation revealing a Vhalf of activation of 25 mV.
KV7.5 - Current Voltage Recordings

Screenshot of KV7.5 recordings obtained on an eight-channel Patchliner. Currents are responses to an current voltage relationship type step pulse protocol.
NaV1.5 - Lidocaine Block

Cells were kindly provided by Cytomyx/Millipore.
Full dose response curves at different holding potentials were recorded for each cell (hNav1.5 in HEK293). Currents were elicited by a 10 ms voltage step to 0 mV. Plotted are average peak currents as a function of holding potential and lidocaine concentration.
NaV1.5 - Stable Access Resistance

Cells were kindly provided by Millipore.
The I/V-characteristics of NaV1.5 currents (HEK293) are shown together with the repeated dose dependent block by TTX (lower panel). Five concentrations of TTX (0.3, 1, 3, 10, 30 μM) were applied, followed by washout with antagonist-free buffer and re-application of the same TTX concentrations.
NaV1.8 - Current-Voltage Relationship

Cells were kindly provided by Millipore.
A Raw traces from an exemplar cell recorded on the Patchliner. Shown are current responses to increasing voltage steps from -80 to +60 mV.
B Average current-voltage plot, Vhalf of activation was -9 mV (n = 19).
C Average inactivation plot, Vhalf of inactivation was -24 mV (n = 4). NaV1.8 currents started to activate at about -40 mV, peak response was elicited at around 20 mV.
NaV1.8 - Tetracaine Pharmacology

Cells were kindly provided by Millipore.
A Raw traces from an exemplar cell recorded on the Patchliner showing inhibition of current by increasing concentrations of tetracaine. Shown are current responses to a single step protocol to 20 mV for 25 ms from a holding potential of -90 mV. Current amplitude was completely recovered upon washout of tetracaine (red trace).
B Timeplot of the experiment.
NaV1.8 - Voltage Dependent Block by Tetracaine

Cells were kindly provided by Millipore.
Recordings were made on the Pachliner. The potency of tetracaine was affected by holding potential, becoming less potent with a more negative holding potential. Average concentration response curve for tetracaine, IC50 = 35 ± 8 μM (n = 3) for Vhold - 90 mV and 74 ± 15 μM (n = 4) for Vhold - 120 mV.
Neurons (iPSC-derived) - TXX Block of Sodium Currents

Cells were kindly provided by Cellular Dynamics.
A Block of Na+ current by increasing concentrations of TTX. Current was blocked by low nM concentrations of TTX indicating a TTX sensitive Na+ channel type expressed in this cell.
B Concentration response curve for TTX inhibition, IC50 = 4.9 nM (n =1).
Neurons (iPSC-derived) - Voltage Gated Potassium Currents

Cells were kindly provided by Cellular Dynamics.
A Voltage-gated K+ current recorded in iCell® neurons. Current responses to a voltage step protocol. An outward K+ current can be seen in this cell.
B Corresponding IV plot from an average of 7 cells.
Neurons (iPSC-derived) - Voltage-Gated Sodium Currents

Cells were kindly provided by Cellular Dynamics.
Voltage-gated Na+ current recorded in iCell® Neurons. Current responses to a voltage step protocol.
A large inward Na+ current can be seen in this cell with a K+ outward current present at positive voltages.
B Normalised IV plot from an average of 4 cells.
P2X2/ P2X3 - Application of ATP on the Patchliner

Cells were kindly supplied by Evotec AG, Hamburg, Germany
P2X2/3 recorded from 1321N1 cells on the Patchliner. P2X2/3 was activated by increasing concentrations of ATP with an EC50 = 7.8 ± 1.0 µM (n = 10). ATP was applied for approximately 600 ms using the stacked solutions function of the Patchliner (holding potential = -80mV).
P2X2/ P2X3 - Block by suramin on the Patchliner

Cells were kindly supplied by Evotec AG, Hamburg, Germany
Block of P2X2/3 receptors by suramin. Suramin at increasing concentrations (1 μM - 1 mM) was pre-incubated and then co-applied with 30 μM ATP. Full recovery from block was achieved upon washout (data not shown). Concentration response curve (right) for suramin block, IC50 = 28.0 ± 5.3 μM (n = 7).
P2X2/ P2X3 - Repetitive activation on the Patchliner

Cells were kindly supplied by Evotec AG, Hamburg, Germany
P2X2/3 recorded from 1321N1 cells on the Patchliner. P2X2/3 was activated repetitively (7 times) by 30 µM ATP.
P2X7 - Application of BzATP

Data are taken from Milligan C.J. et al., Nature Protocols, 2009, 4(2), 244-255.
BzATP concentration response curve obtained from wild-type P2X7 receptors. Data are fite to the Hill equation with an EC50 of 69.7 ± 7.5 μM. The inset show representative currents evoked by BzATP (3 − 100 μM). Holding potential was −60 mV.
Potassium Currents - Measuring Human Lymphoblasts

Data are taken from Milligan C.J. et al., Nature Protocols, 2009, 4(2), 244-255.
An illustrative typical family of traces obtained during construction of a current voltage relationship from a human lymphoblast recording using amphotericin B (perforated patch). Currents were evoked by voltage steps from holding (−80 mV) to potentials varying from −100 mV to +60 mV.
TRP Channels - Currents in Smooth Muscle Cells

Data are taken from Milligan C.J. et al., Nature Protocols, 2009, 4(2), 244-255.
Left: Illustrative time series showing currents at +80 mV and −80 mV in a smooth muscle cell exposed to extracellular Gd3+ (100 μM) and then 2-APB (75 μM). Right: Membrane resistance (Rm), series resistance (RS) and membrane capacitance (Cm) values for successful recordings from smooth muscle cells.
TRPA1 - Current Time Course

Cells were kindly supplied by Millipore.
Shown is the time course of the current measured at +95 mV from an individual cell. The legend indicates the time periods in which the activator AITC was applied. Here we demonstrate the reproducibility of the current responses for TRPA1.
TRPA1 - Current Traces

Cells were kindly supplied by Millipore.
Shown is a screenshot from a recording on a 4-channel Patchliner from HEK293 cells expressing TRPA1. Currents were activated by ca. 20 s application of 3 μM AITC followed by wash out. On the left raw whole cell currents as responses to 0.2 s voltage ramps (−100 mV to +100 mV) which were applied every 10 s are shown. On the right currents at +95 mV are plotted against time.
TRPC1 (Smooth Muscle Cells) - Pharmacology

Data are taken from Li, J. et al., Circulation Research, 2008,103(8), e97-104.
(a) Example whole cell recording showing current evoked by extracellular application of 2 μM thapsigargin (TG) and subsequent inhibition by 10 μM lanthanum (La3+). (b) As for (a) but showing the effect of 20 μg/ml anti-STIM1 antibody. (c) For the experiment shown in (b), curren voltage relationships for the current evoked by TG and blocked by anti-STIM1 antibody. (d) Mean currents normalized to pre-antibody values showing the effect of 20 μg/ml ani-STIM1 antibody and lack of effects for IgG or denatured anti-STIM1 antibody.
TRPC5 - Block by Gadolinium

Data are taken from Milligan C.J. et al., Nature Protocols, 2009, 4(2), 244-255.
Current voltage relationships showing activaion of TRPC5 by extracellular application of Gd3+ (100 μM). Voltage ramps (−100 mV to 100 mV, holding potential 0 mV) were for 1s at 0.1 Hz.
TRPM3 - Pharmacology

Data are taken from Naylor J. et al., British Journal of Pharmacology, 2008, 1-7.
Shown are whole cell currents as responses to 0.2 s voltage ramps (−100 mV to +100 mV) which were applied every 10 s. All cells were HEK293 cells induced to express TRPM3. (a and c) Mean currents sampled at −80 and +80 mV, each normalized to the amplitude immediately before bath application of antiserum (TM3E3; 1:500 dilution) without (a, n = 8) or with (c, n = 4) pre-adsorption to 10 μM antigenic peptide. Pregnenolone sulphate (PregS) was bath applied at 25 μM. (b and d) Typical current voltage relationships from the experiments underlying (a) and (c).
TRPM3 - Positive modulation

Cells were kindly provided by Prof. Thomas Voets, KU Leuven, Belgium.
A Current responses to a voltage ramp protocol from -150 mV to 150 mV over 200 ms in response to 100 μM pregnenolone sulphate (PS) and in combination with increasing concentrations of compound C. B Current responses elicited by PS, enhancement by 30 μM compound C and block of the current by co-application of antagonist (10 μM).
TRPV1 - Transient Heat Activation

The current responses of a CHO cell expressing TRPV1 (ramp -100 mV to +100 mV) at increasing temperatures is shown. The ET50 value was determined as 64°C. Challenge of the same cell with capsaicin (1 μM) and temperature (70°C) allows comparison of the responses. IC50s for ruthenium red block of capsaicin- and heat-responses were determined as 1.6 ± 0.2 μM (n = 3) and 7.4 ± 1.3 μM (n = 3), respectively.
TRPV3 - Temperature Activation
 Cells were kindly supplied by Millipore.
Recordings from a HEK cell expressing TRPV3 were made with the Patchliner showing activation by heat. External solution was heated inside the Patchliner pipette to the temperature shown and applied to the cells. TRPV3 was activated at temperatures ≥ 38°C.
发表文献:
2022 - Synergistic Adverse Effects of Azithromycin and Hydroxychloroquine on Human Cardiomyocytes at a Clinically Relevant Treatment Duration
2022 - Multitarget nociceptor sensitization by a promiscuous peptide from the venom of the King Baboon spider
2022 - Ion Channel Modeling beyond State of the Art: A Comparison with a System Theory-Based Model of the Shaker-Related Voltage-Gated Potassium Channel Kv1.1
2021 - The translocator protein ligands as mitochondrial functional modulators for the potential anti-Alzheimer agents
2021 - The Agonist Action of Alkylphenols on TRPA1 Relates to Their Effects on Membrane Lipid Order: Implications for TRPA1-Mediated Chemosensation
2021 - Effects of nicotinic acetylcholine receptor‑activating alkaloids on anxiety‑like behavior in zebrafis
2021 - Dynamic Clamp in Electrophysiological Studies on Stem Cell–Derived Cardiomyocytes—Why and How?
2021 - Cell engineering method using fluorogenic oligonucleotide signaling probes and flow cytometry
2021 - BAY-8400: A Novel Potent and Selective DNA-PK Inhibitor which Shows Synergistic Efficacy in Combination with Targeted Alpha Therapies
2021 - Applying automated patch-clamp to disease modeling: recapitulate phenotypes of Brugada syndrome using iPSC-CMs
2021 - Antiarrhythmic Hit to Lead Refinement in a Dish Using Patient-Derived iPSC Cardiomyocytes


耐尼恩技术(北京)有限公司
实名认证
金牌会员
入驻年限:4年
